DieSquare for iOS
Ole Zorn’s Pythonista for iOS is an amazing mobile development environment. If you can do it in base Python, you can do it, inside a GUI, on your iPhone or iPad. This makes it a great tool for gamers who are also programmers.
My dice always seem to be conspiring against me, which is a big reason I’m interested in running chi-square tests. R is an amazing tool for doing so, but it isn’t an amazing tool for entering the data. Last week, after yet another accusation from my teammates that my die is clearly biased to roll low—in a D&D 5 game, where high is better—I started to think they might be right. The first time the accusation was made, I said, look, it’s just because the die knows I’m attacking. I’m going to roll it right now for no reason whatsoever, and the die will come up 20. It did. The die isn’t biased to roll low, it’s biased against me. But it just kept failing.
I thought I’d better double check. Because I am a typical superstitious gamer, I have different dice for different purposes, and this is in fact the first time I’ve used this die—I had it reserved for playing rather than gamemastering. It occurred to me that, since I wrote Are my dice random? in 2006, I have acquired both a great mobile device and a great development environment for it. Wouldn’t it be nice to be able to bring up a table of possible rolls, and tap on each possibility when it came up on the die so as to keep track of each count? That would make rolling through a chi-square test dead easy.
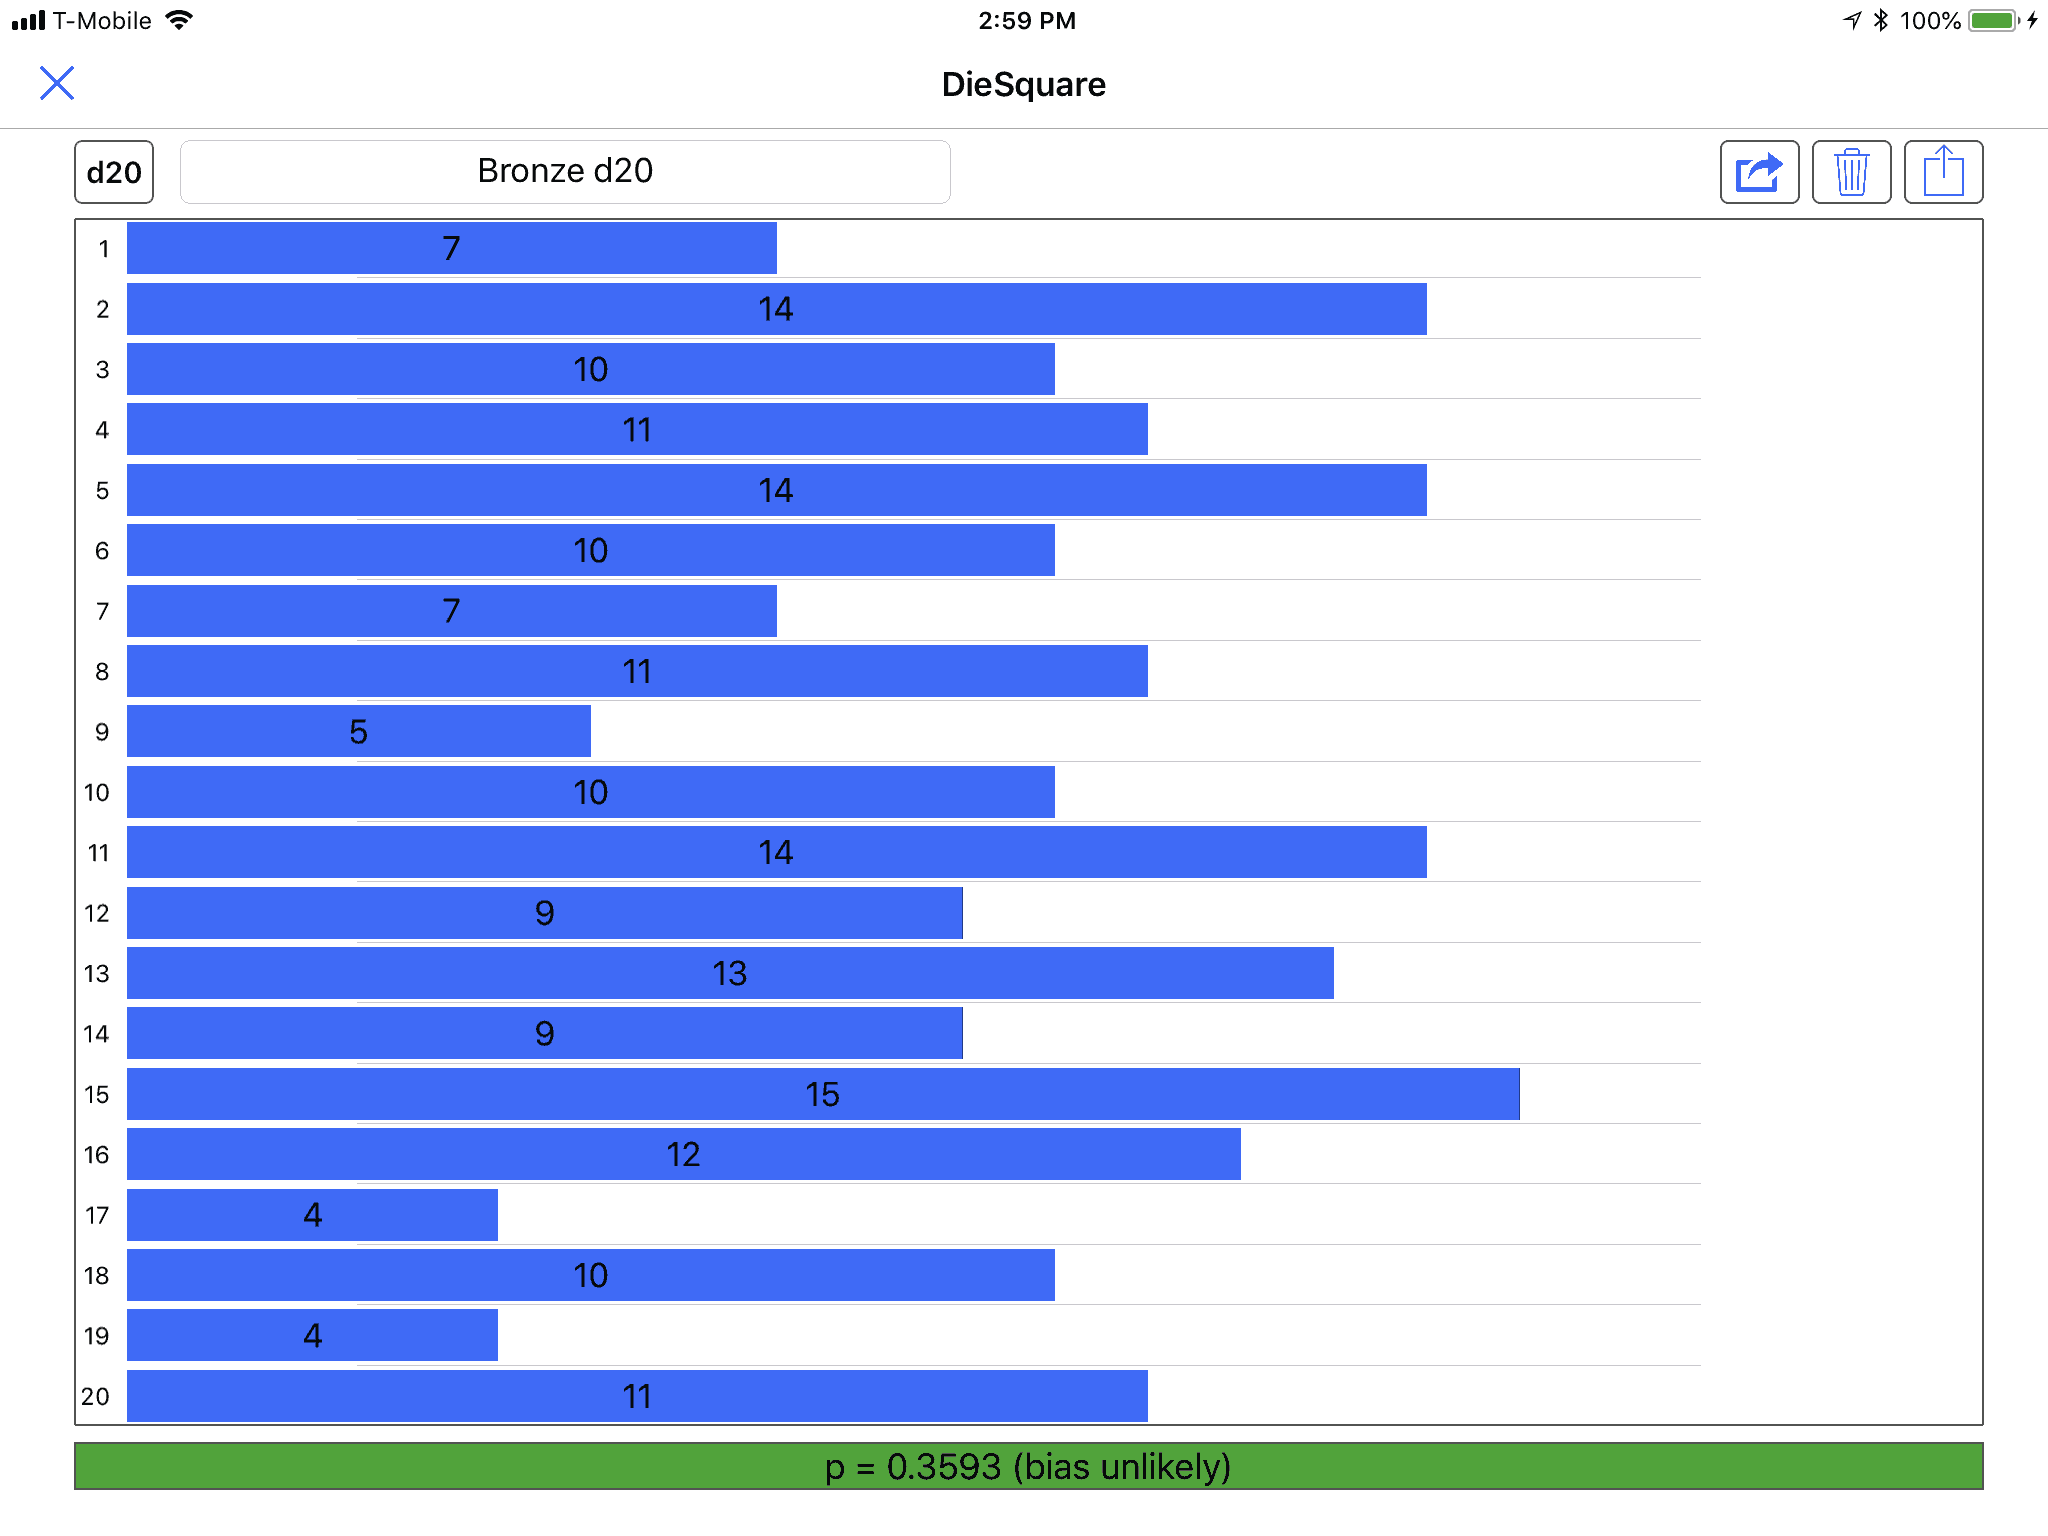
I wrote it this weekend in Pythonista. The basic idea is that you choose the die size, and then each possible die roll shows up in a table as a row. Tap the row to add one hit to that result. Slide to remove if you accidentally tapped the wrong row.1 Give the die a name if you want the results saved, and there is an icon to (a) share, for example, copy, the data or results, (b) trash the data and start over, (c) load previously-saved data. Data is automatically saved if you give the die a name. Once you hit a minimum of ten rolls per face on the die (with an absolute minimum of 50 rolls), it calculates the p-value for that data.
If you just want to use the script, download it (Zip file, 6.4 KB), unzip it, and install the folder under Pythonista 3 in your iCloud Drive folder.
If you prefer to roll more often than ten rolls per face on the die, change rollsPerFace at the top of the file.
Building an interface like that in Pythonista is very easy. Add, using the “+” button, a UI File or a Script with UI, and Pythonista will create a .pyui, or Pythonista User Interface, file. I usually give the ui file the same name as the main script file. In this case, “DieSquare.py” for the script file and “DieSquare.pyui” for the interface file. Adding interface elements is as simple as hitting the ”+”, currently in the upper left.2
The interface elements auto-resize and flex just like elements created in Xcode, and you have control over where and in what directions they flex.
| Element | Type | Position | Size | Flex | Font Size | Alignment | Image | Background Color |
|---|---|---|---|---|---|---|---|---|
| dieSize | Button | 37, 6 | 40, 32 | all outer | 15 | |||
| dieName | TextField | 90, 6 | 280, 32 | top, left, bottom, horizontal | 17 | center | ||
| share | Button | 604, 6 | 40, 32 | top, right, bottom | 15 | share_256 | ||
| trash | Button | 650, 6 | 40, 32 | top, right, bottom | 15 | ios7_trash_outline_256 | ||
| load | Button | 696, 6 | 40, 32 | top, right, bottom | 15 | ios7_upload_outline_256 | ||
| dieRolls | TableView | 37, 45 | 699, 868 | all | 18 | |||
| progressGroove | Label | 37, 921 | 699, 24 | left, bottom, right, horizontal | 14 | left | #a5a5a5 | |
| progress | Label | 37, 921 | 150, 24 | left, bottom, right, horizontal | 18 | center | #25a525 |
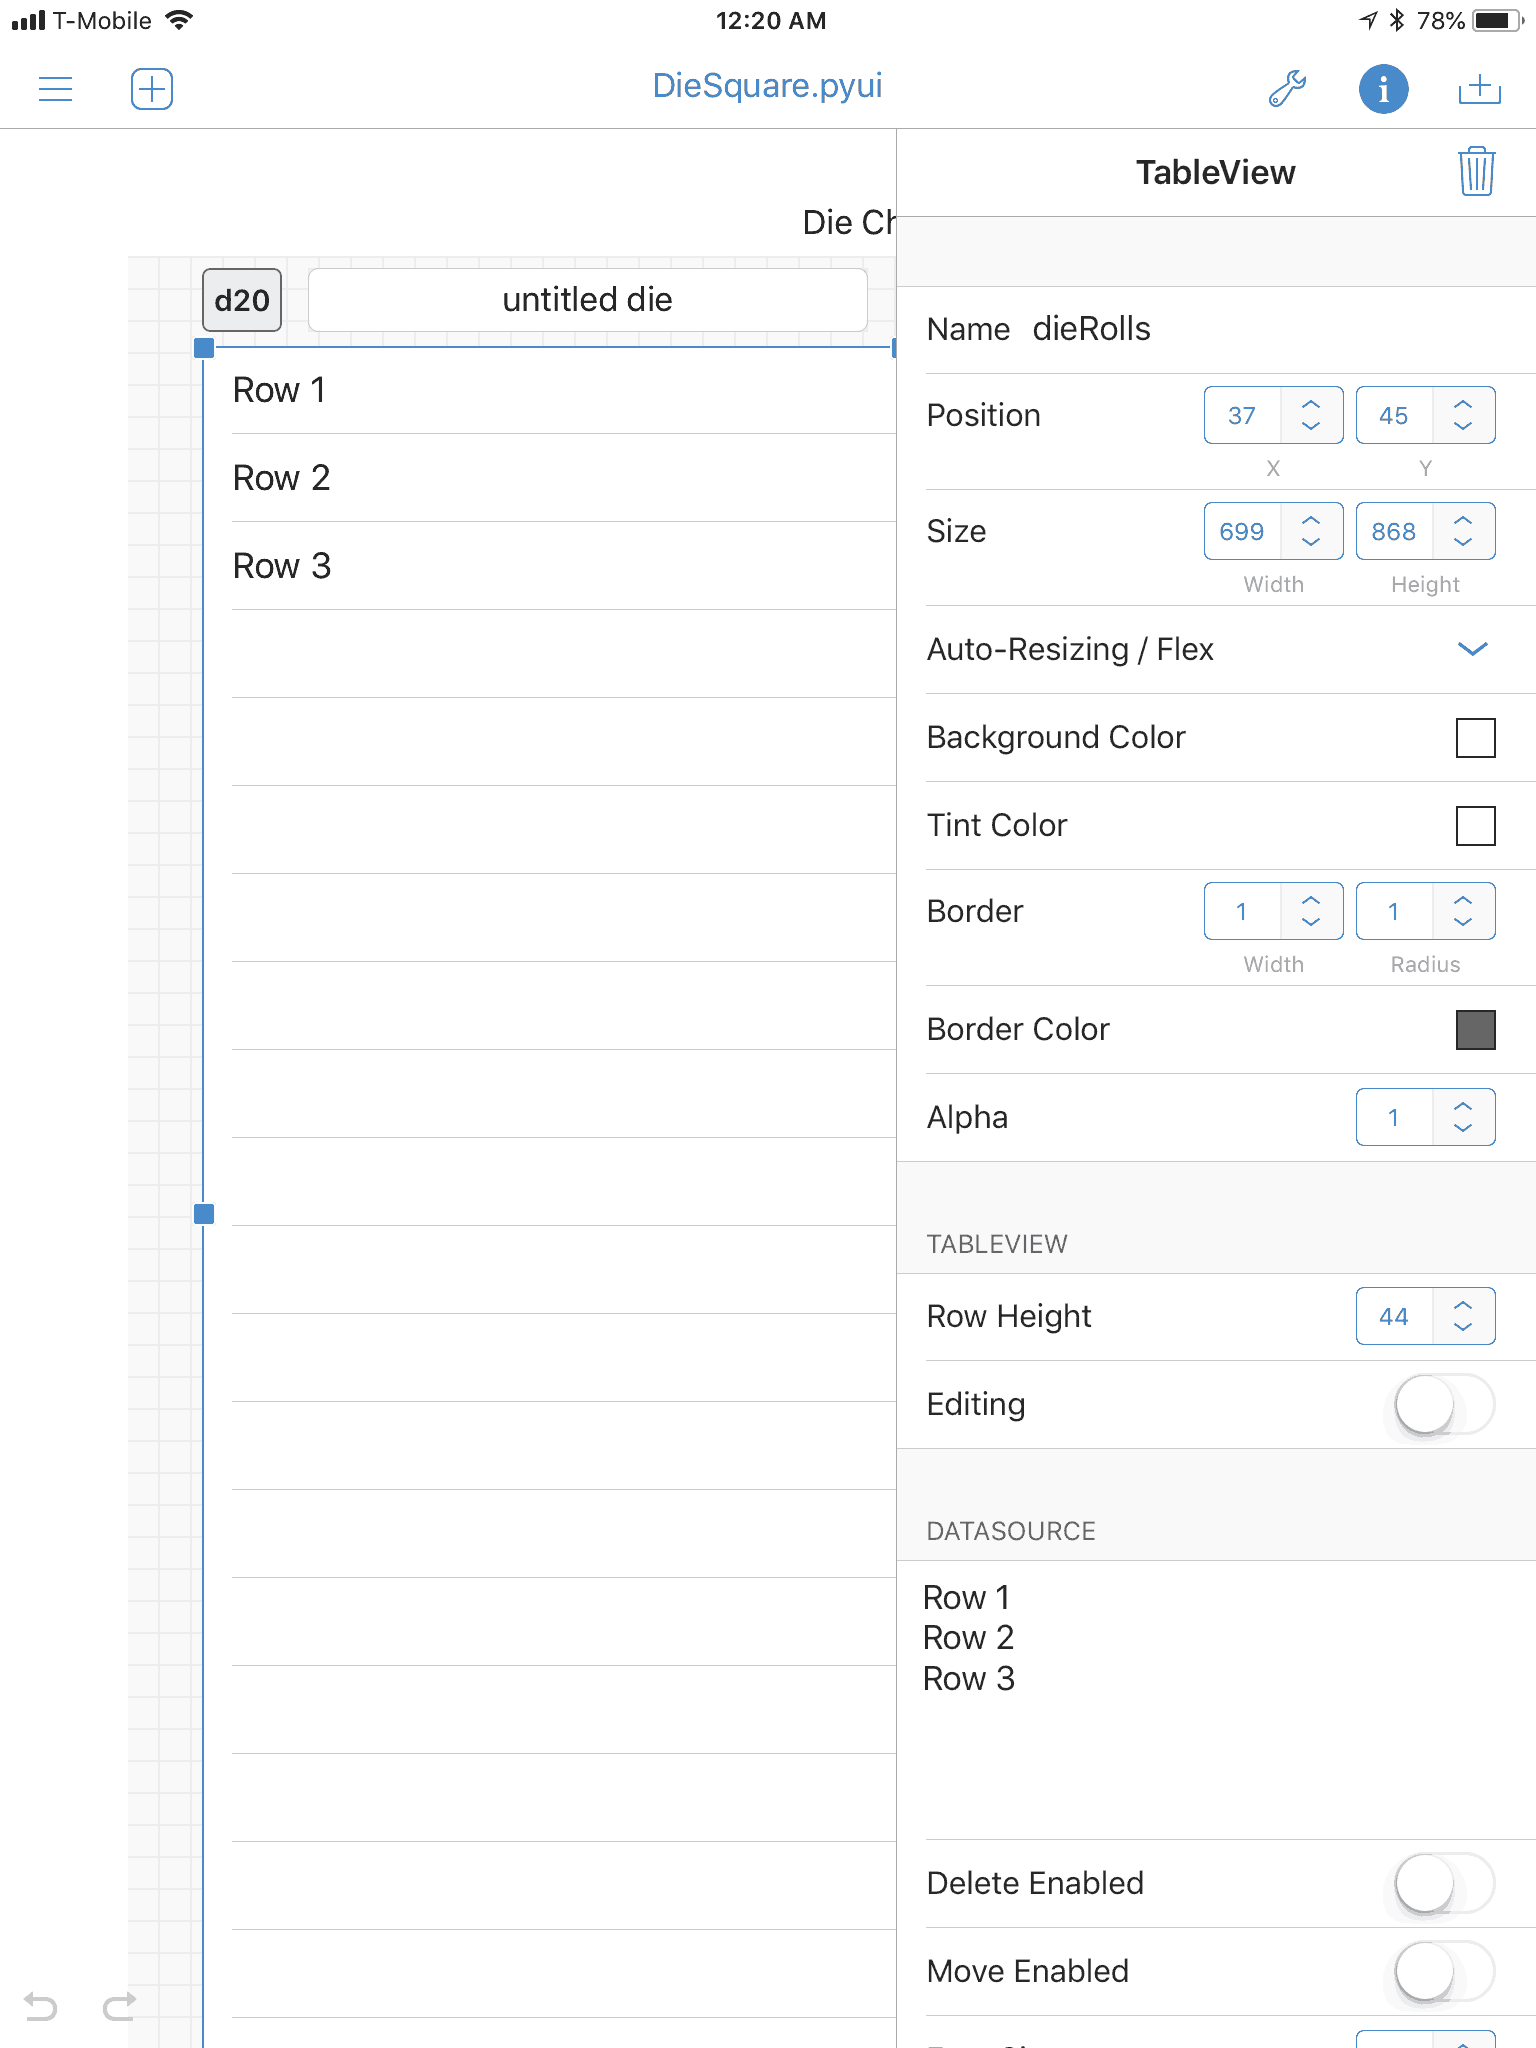
Creating an interface in Pythonista.
The downloadable also contains the .pyui file I’m using.
There are two classes in the script file: RollView, which inherits from ui.View and does most of the display work; and Grid, which inherits from ui.ListDataSource and is the delegate and data source for the main table, the one that displays all the die rolls and accepts taps to add to a particular result’s count.
[toggle code]
-
def did_load(self):
- self.grid = Grid(items=[])
- self['progress'].hidden = True
- self['dieRolls'].data_source = self.grid
- self['dieRolls'].delegate = self.grid
- self['dieSize'].action = self.chooseDieSize
- self['load'].action = self.load
- self['trash'].action = self.trash
- self['share'].action = self.share
- self['dieName'].delegate = self
- self.setDie()
When Pythonista finishes loading the main view, it sends did_load to that view. This is a good place to add actions, data sources, and delegates to the various elements. Each of these actions are methods on the RollView class. The data source and delegate for the table of rolls is the Grid class, and the delegate for the text field that contains your custom name for the die you’re rolling3 is the RollView class itself.
As its last action, did_load sets up the die data, defaulting to d20, setting the total count of rolls to 0, creating an empty list of rolls, making sure the filename/die name is back to the default, and displaying an empty table of rolls.
Delegates in Pythonista are just objects that implement specific methods. For the name of the die (which doubles as the name of the file that data for that die is saved in), the only method I’m implementing is textfield_did_end_editing. That is, if the filename has been changed, the script needs to record it and act on it.
[toggle code]
-
def textfield_did_end_editing(self, textview):
- textview.text = textview.text.strip()
-
if textview.text == self.emptyFilename:
- return
-
if textview.text == self.filename:
- return
-
if not textview.text:
- textview.text = self.emptyFilename
- return
- filepath = self.makeFilepath(textview.text)
-
if os.path.exists(filepath):
- response = dialogs.alert('File exists', 'The file ' + textview.text + ' already exists. Do you want to erase that file?', 'Yes, erase', 'No, cancel', hide_cancel_button=True)
-
if response == 2:
- textview.text = self.filename or self.emptyFilename
- return
- self.filename = textview.text
- self.save()
If the name of the die remains untitled die, ignore it. If it is the name of the current file, then it hasn’t changed, so ignore it also. And if it’s empty, then set it to ‘untitled die’ and ignore it.
If, however, there is a new die name, then it converts that die name into a path to save the data to, which will be the folder “data”, and the die name plus the extension “.diesquare”. You can look at these files in iCloud Drive under Pythonista 3.
If the file exists, it asks if you want to erase that file; if not, it cancels the die name change.
If all goes well, it changes the filename to match the die name.
The Grid class is all delegate methods.
[toggle code]
-
class Grid(ui.ListDataSource):
-
def tableview_did_select(self, tableview, section, row):
- roll = self.items[row]
- view.newRoll(roll)
- tableview.selected_row = 0,-1
- tableview.reload()
-
def tableview_delete(self, tableview, section, row):
- roll = self.items[row]
- view.removeRoll(roll)
- tableview.reload()
- return False
-
def tableview_cell_for_row(self, tableview, section, row):
- rowView = ui.TableViewCell()
- roll = self.items[row]
- # create cell for roll number
- rollCell = ui.Label(text = str(roll))
- rollCell.height = tableview.row_height - 4
- rollCell.font = self.font
- rollCell.y = 2
- rollCell.width = 1.5*self.font[1]
- rollCell.alignment = ui.ALIGN_RIGHT
- rowView.add_subview(rollCell)
- # create cell for count bar
- maximumUnits, units = view.getDieProgress(roll)
-
if units:
- progress = ui.Label(text = str(units), alignment = ui.ALIGN_CENTER)
- progress.x = 2.2*self.font[1]
- progress.height = tableview.row_height-4
- progress.y = 2
- progress.width = units/maximumUnits*(tableview.width - progress.x)
- progress.background_color = '#2f6bff'
- rowView.add_subview(progress)
- return rowView
-
def tableview_did_select(self, tableview, section, row):
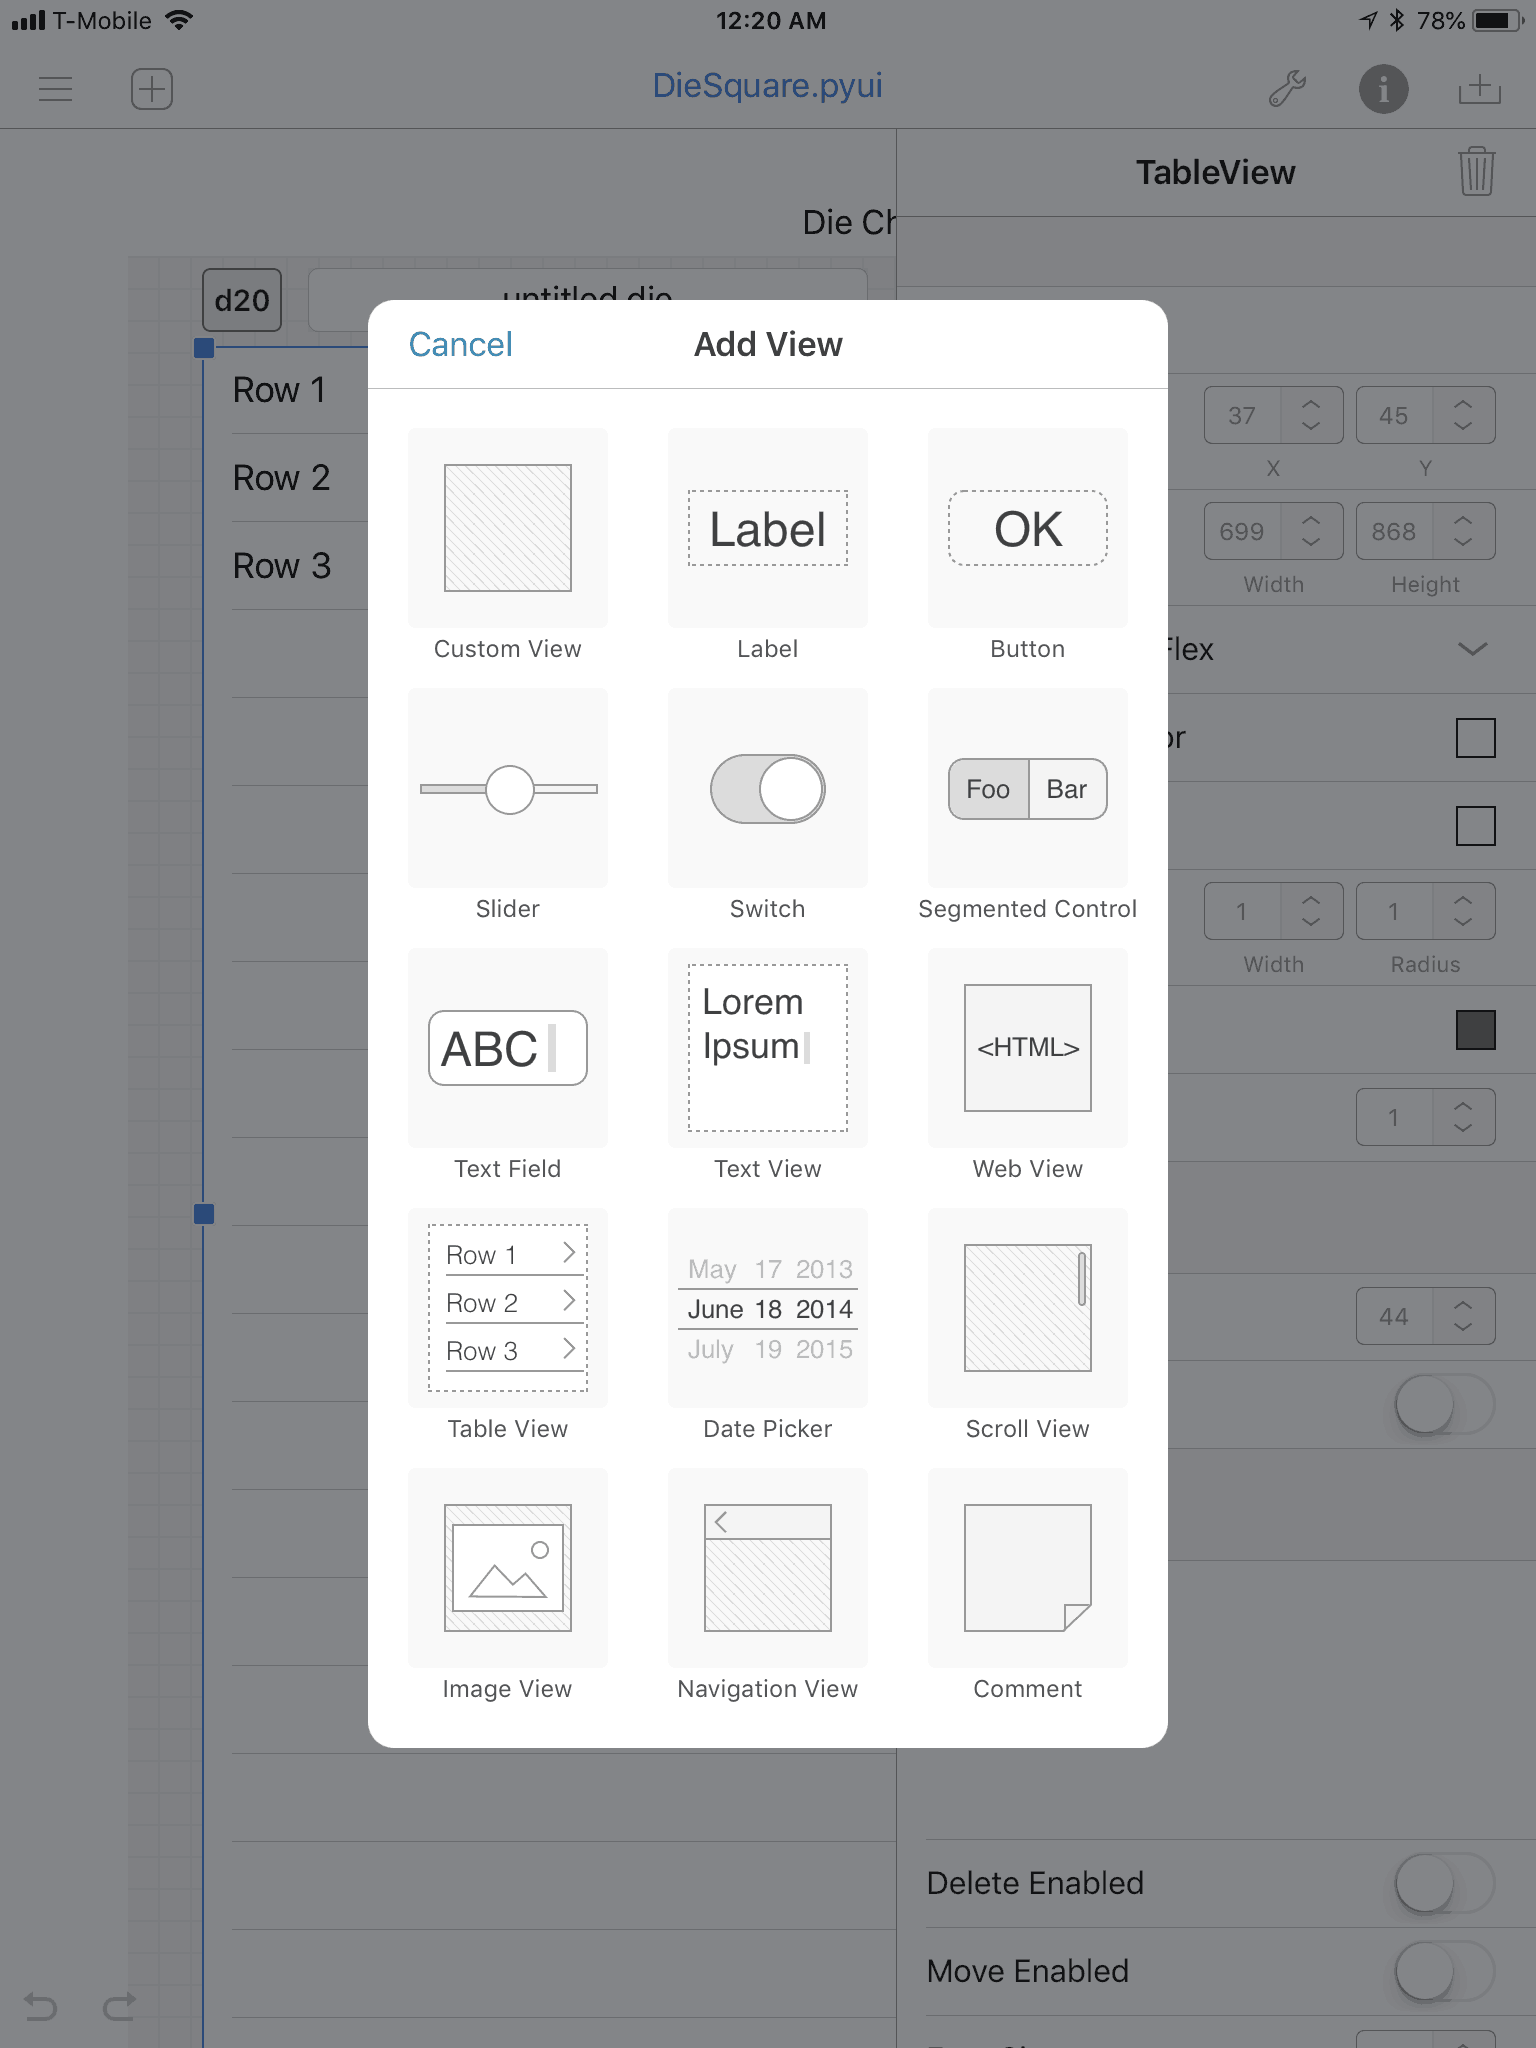
Adding interface elements such as buttons and text fields is easy.
If a table row was tapped (tableview_did_select), the roll is recorded, the row is deselected, and the table is reloaded so as to reflect the new data.
If a table row was deleted (tableview_delete), the roll is removed from the total, the table is reloaded to reflect the removal, and the method returns False to cancel the actual deletion of the row.
When the table is being displayed, Pythonista calls tableview_cell_for_row for each row in the table; if it’s a d20, this will be called 20 times. This method has two parts. It creates the die roll (1 through 20), and then it creates a progress bar that reflects how many times this result has been hit so far. Both those parts are Label interface elements. They’re each added as subviews to the empty ui.TableViewCell and then returned by the method for display as that row.
- view = ui.load_view()
- view.present()
To start the code running, the main view is loaded and presented. This starts the die rolling, so to speak, culminating in all of the code in did_load, at which point all of the interface elements are waiting for interaction.
[toggle code]
-
def draw(self):
- if hasattr(self, 'die'):
- self.createGrid()
Whenever the iPad or iPhone is rotated, Pythonista calls the draw method to redraw the screen. The flex settings on each element will handle most of the changes necessary to adjust to the new screen size. The rest of the intelligence needed is in the progress method.
[toggle code]
-
def progress(self):
-
if not self.rollCount:
- self['progress'].hidden = True
- return
- self['progress'].hidden = False
- maxWidth = self['progressGroove'].width
- sampleSize = self.sampleSize()
- self['progress'].width = min(sampleSize, self.rollCount)/sampleSize*maxWidth
-
if self.finished():
- self['progress'].text, results = self.chisquare()
-
else:
- self['progress'].text = str(sampleSize-self.rollCount)
- self['progress'].background_color = '#25a525'
-
if not self.rollCount:
- If there haven’t been any rolls yet, just hide the progress bar.
- Otherwise, size the progress bar against the “groove” that it’s running in, increasing to match that width as the roll count approaches the number necessary to make a reasonable chi-square calculation.
- If no more die rolls are necessary, display the p-value from the chi-square test.
- Otherwise, display the number of rolls remaining before the chi-square test can be performed.
[toggle code]
-
def share(self, button):
- options = ['Text Table', 'R Script']
-
if self.rollCount:
- options.append('Chi-Square Calculations')
- format = dialogs.list_dialog('Choose format to share:', options)
-
if format == 'R Script':
- die = str(self.die)
- observed = 'd' + die + ' <- matrix(c('
- numbers = []
-
for roll in range(1, self.die+1):
-
if roll in self.rolls:
- count = self.rolls[roll]
-
else:
- count = 0
- numbers.append(str(count))
-
if roll in self.rolls:
- observed += ', '.join(numbers)
- observed += '), ncol=' + die + ', byrow=TRUE)'
- expected = 'probability = rep(1/' + die + ', ' + die + ')'
- chisquare = 'chisq.test(d' + die + ', p=probability)'
- lines = [observed, expected, chisquare]
-
elif format == 'Text Table':
- lines = []
-
if self.filename:
- lines.append('# ' + self.filename)
- lines.append('')
- lines.append('## d{} ({} rolls)'.format(self.die, self.rollCount))
- lines.append('')
- lines.append("roll\tcount")
-
for roll in range(1, self.die+1):
-
if roll in self.rolls:
- count = self.rolls[roll]
-
else:
- count = 0
- lines.append(str(roll) + '\t' + str(count))
-
if roll in self.rolls:
-
elif format == 'Chi-Square Calculations':
- pvalue, lines = self.chisquare()
-
else:
- return
- text = "\n".join(lines)
- destination, dummy = dialogs.share_text(text)
-
if destination:
- dialogs.hud_alert('Shared!', 'success')
-
else:
- dialogs.hud_alert('Share canceled.', 'error')
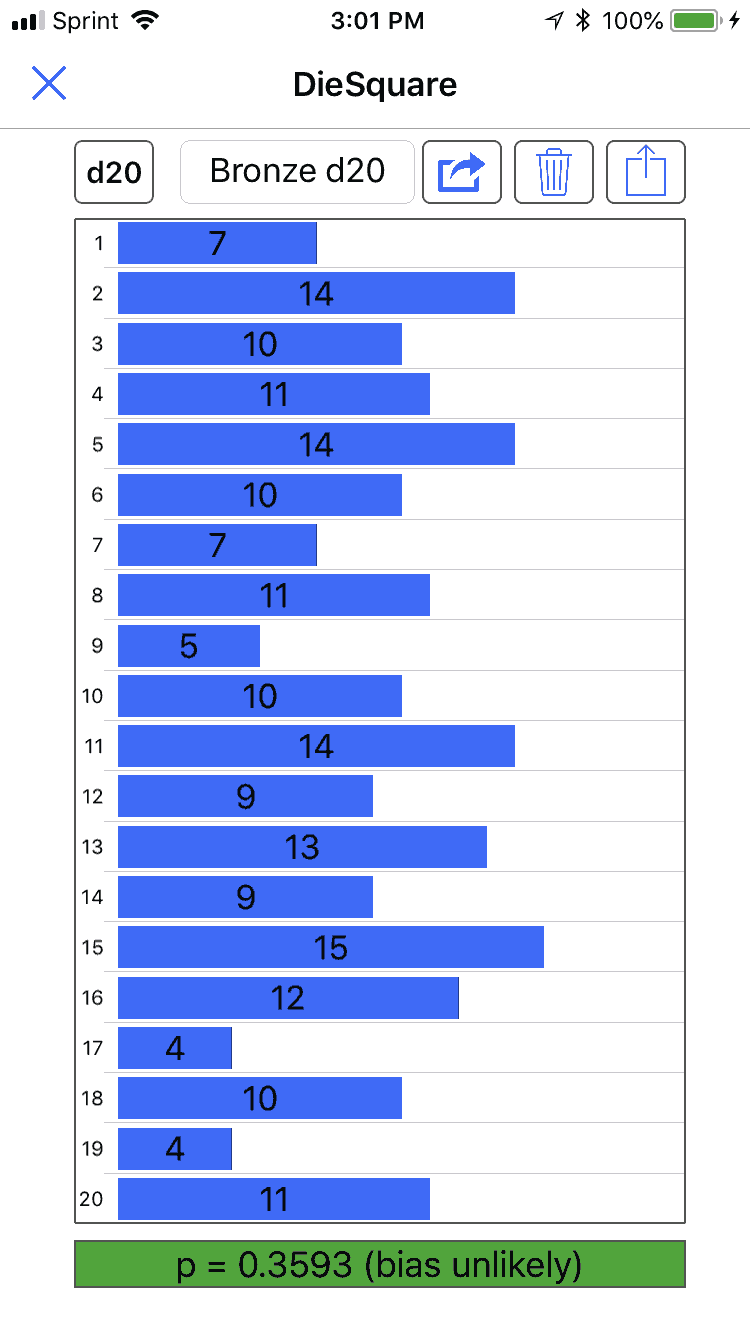
The interface automatically resizes most of its elements to match the iPhone when run on that smaller screen.
The share method prepares text for the standard iOS share options. Often, this will be copying the text for use elsewhere. Before getting to the share options, it asks whether you want a text table, an R script, or, if there have been enough rolls, the chi-square test.
Once the text has been created, it can be sent to the share options using dialogs.share_text(text).
The most reliable option is to take the data and paste it into R. Pythonista does not include the scipy module which is how most Python scripts perform a chi-square test. I was, however, able to find a means of constructing the chi-squared values and then performing the goodness of fit test manually. It matches R nearly exactly4 for real data. In testing fake data, trying to force a biased die, however, I found that this method can fail due to lack of precision and to numbers too big for basic Python to handle5. If it does fail, the script will display the reason for the failure.
I’ve modified the code on that page to exit once the numerator or denominator converges; that appears to be the point when the result is reliable. If the number never settles down, it isn’t going to produce a valid p-value. This is a deduction made from watching how the code works. It is not necessarily true.
The main purpose of this app is to make it easy to enter the data. It would be nice if it could also perform the chi-square test, and it appears that it can, but it’s also easy to force a failure. For example, choose a d4 and enter data on a single number until you have enough rolls. This is obviously a biased die—it’s also obviously not a data set that is in any way possible in real life even with a biased die. But it does show that this code does not handle edge conditions well. I think I have successfully detected those edge conditions, but I may well be wrong.
If you’re unsure about whether the p-value is correct, copy the data into R.
In response to Are my dice random?: My d20 appears to have been rolling a lot of ones, a disaster if I were playing D&D but a boon for Gods & Monsters. Is my die really random, or is it skewed towards a particular result? Use the ‘R’ open source statistics tool to find out.
- June 27, 2018: Command-line Die Square
-
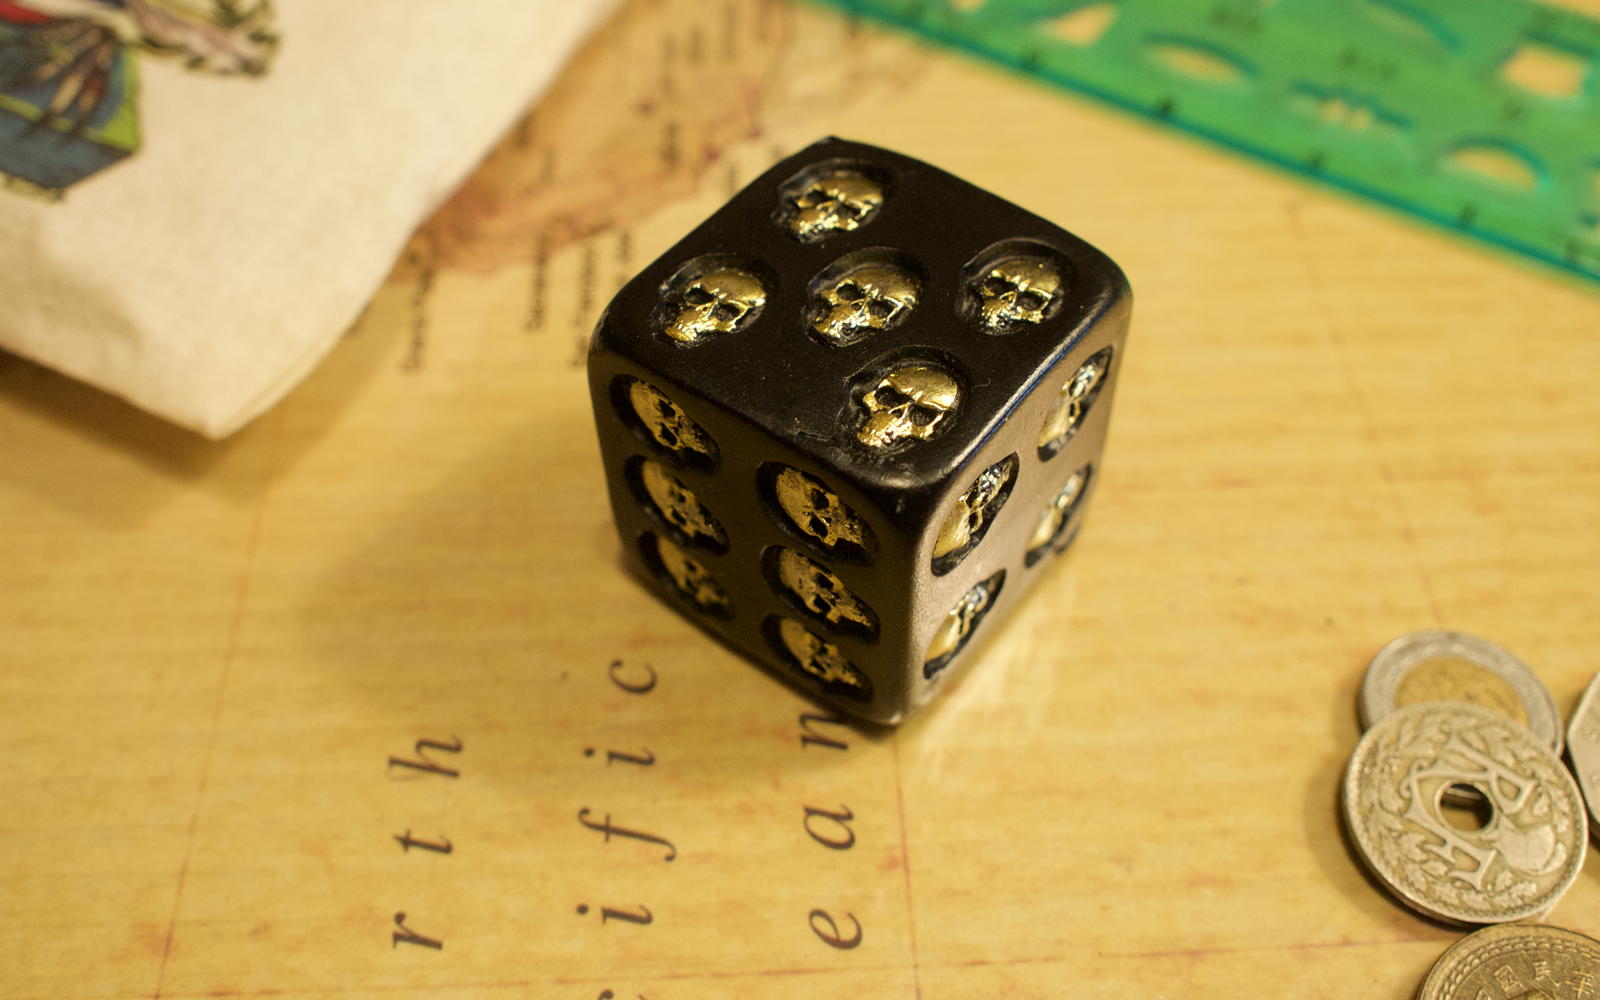
Is it any surprise that a die covered in skulls is biased?
Because Pythonista does not contain scipy, calculating chi-square values using it can have trouble on edge cases. This command-line script can run on data files created by the DieSquare mobile app, and uses scipy to make more reliable calculations.
Specify the DieSquare data file on the command line.
- $ ~/bin/diesquare "Bronze d20.diesquare"
- Degrees of freedom: 19.0 X-square: 20.6
- p-value: 0.359317617197
- d20 bias is unlikely.
You can also specify the die size and a file of tab-delimited or colon-delimited data. The file should contain two columns: the result, and how many of those results occurred.
The DieSquare file format is:
- d6
- 1: 3
- 2: 16
- 3: 9
- 4: 8
- 5: 6
- 6: 18
That is, any line beginning with a lower-case “d” is assumed to be specifying the die size; any line with a number followed by a colon and space followed by a number is assumed to be a result. You can also put comments in by preceding the line with a pound symbol (#).
And as you might guess, this die is almost certainly biased.
- $ ~/bin/diesquare "Skull d6.diesquare"
- Degrees of freedom: 5.0 X-square: 17.0
- p-value: 0.00449979697797
- d6 bias is probable.
The code itself (Zip file, 1.6 KB) is very simple.
[toggle code]
- #!/usr/bin/python
- #http://godsmonsters.com/Features/my-dice-random/diesquare-ios/command-line-die-square/
- import argparse
- import scipy.stats
- parser = argparse.ArgumentParser(description='Calculate Chi Square p-value using DieSquare data files.')
- parser.add_argument('--die', type=int, help='die size')
- parser.add_argument('data', type=argparse.FileType('r'), nargs=1)
- parser.add_argument('--verbose', action='store_true')
- args = parser.parse_args()
-
class ChiSquare():
-
def __init__(self, die, rolls):
- self.die = die
- self.parseRolls(rolls)
-
def parseRolls(self, rolls):
- self.rollCount = 0
- self.rolls = {}
-
for roll in rolls:
-
if not roll:
- continue
-
if roll.startswith('d'):
- self.die = int(roll[1:])
- continue
-
if roll.startswith('#'):
- continue
-
if not roll:
-
if args.verbose:
- print(self.rollCount)
- print(self.rolls)
-
def calculate(self):
-
if args.verbose:
- print '\n# ', self.die
- expected = float(self.rollCount)/float(self.die)
- freedom = float(self.die - 1)
- observed = self.rolls.values()
- expected = [expected]*self.die
- chisquare, pvalue = scipy.stats.chisquare(observed, expected)
- print "Degrees of freedom:", freedom, "X-square:", chisquare
- print "p-value:", pvalue
-
if args.verbose:
-
def __init__(self, die, rolls):
- calculator = ChiSquare(args.die, args.data[0])
- calculator.calculate()
Half of the code is just parsing the datafile; the actual calculation is a couple of lines using scipy:
- observed = self.rolls.values()
- expected = [expected]*self.die
- chisquare, pvalue = scipy.stats.chisquare(observed, expected)
The variable “observed” is the list of observed result counts. The variable “expected” is the list of expected result counts. For example, rolling a d6 60 times, the expected result count is 10 for each result, so expected will equal “[10, 10, 10, 10, 10, 10]”. And observed will be the actual results; for example, in the above data the die face 1 was rolled three times, 2 sixteen times, 3 nine times, 4 eight times, 5 six times, and 6 eighteen times. This is the list “[3, 16, 9, 8, 6, 18]”. The script, of course, uses the lists it constructed by reading the datafile.
This hasn’t yet happened to me, although it might if I used the iPhone for data entry.
↑Obviously, the exact placement of controls may change in future versions of Pythonista.
↑Such as, “My yellow die” or “Translucent Blue d20”.
↑Out to 4 decimal points.
↑Python’s decimal package can improve the results, but at the cost of performing the calculations much more slowly. I may do another post on that.
↑
- DieSquare for iOS and Pythonista (Zip file, 6.4 KB)
- Quickly test a die for bias using a chi-square test. Requires Pythonista on iOS.
- Are my dice random?
- My d20 appears to have been rolling a lot of ones, a disaster if I were playing D&D but a boon for Gods & Monsters. Is my die really random, or is it skewed towards a particular result? Use the ‘R’ open source statistics tool to find out.
- Chi-Square Statistic: How to Calculate It / Distribution
- “As you can probably imagine, the calculations can get very, very, lengthy and tedious. Instead, you’ll probably want to use technology…”
- Performing a Chi-Squared Goodness of Fit Test in Python
- “The chi-squared goodness of fit test or Pearson’s chi-squared test is used to assess whether a set of categorical data is consistent with proposed values for the parameters.”
- Pythonista
- “Bring the Zen of Python to iOS.”
- The R Project for Statistical Computing
- “R is a language and environment for statistical computing and graphics. R provides a wide variety of statistical and graphical techniques, and is highly extensible.”
More chi-square
- Command-line Die Square
- Running chi-square on the command-line, using data from the mobile Pythonista app.
- Are my dice random?
- My d20 appears to have been rolling a lot of ones, a disaster if I were playing D&D but a boon for Gods & Monsters. Is my die really random, or is it skewed towards a particular result? Use the ‘R’ open source statistics tool to find out.
More iOS programming environments
- Flashcards for iPad using Pythonista
- Build a simple flashcard app for foreign phrases or whatever using photo albums and Pythonista.
- Preflighting blog comments in the Pythonista share screen
- I now use Pythonista’s sharing extension to ensure that comments on other people’s blogs are appropriately formatted.
- HotPaw Basic on iOS
- Looks like there’s a minor renaissance in programming languages on the iPhone and iPad. HotPaw BASIC is one of the first.
More Programming for Gamers
- Are my dice random?
- My d20 appears to have been rolling a lot of ones, a disaster if I were playing D&D but a boon for Gods & Monsters. Is my die really random, or is it skewed towards a particular result? Use the ‘R’ open source statistics tool to find out.
- Programming for Gamers: Choosing a random item
- If you can understand a roleplaying game’s rules, you can understand programming. Programming is a lot easier.
- Easier random tables
- Rather than having to type --table and --count, why not just type the table name and an optional count number?
- Programming a Roman thumb
- Before we move on to more complex stuff with the “random” script, how about something even simpler? Choose or die, Bezonian!
- Multiple tables on the same command
- The way the “random” script currently stands, it does one table at a time. Often, however, you have more than one table you know you’re going to need. Why not use one command to rule them all?
- 12 more pages with the topic Programming for Gamers, and other related pages
More Pythonista
- Flashcards for iPad using Pythonista
- Build a simple flashcard app for foreign phrases or whatever using photo albums and Pythonista.
- Preflighting blog comments in the Pythonista share screen
- I now use Pythonista’s sharing extension to ensure that comments on other people’s blogs are appropriately formatted.
- Draw a circle on an iPad map from three points in Pythonista
- Use Pythonista on the iPad to import a map screenshot, tap three points, and draw a circle from those three points. This simple shell can be used for other on-the-fly programming, too.
